Profiling
In this section, we'll explore how to profile Rspack for identifying bottlenecks. By examining where Rspack spends its time, we can gain insights into how to improve performance. Since different profilers have different strengths. It is good to use more than one.
Tracing
tracing is used to instrumenting Rspack.
The supported tracing levels for
- release builds are
INFO,WARNandERROR - debug builds are
TRACE,DEBUG,INFO,WARNandERROR
Two ways to enable tracing:
- if you are using
@rspack/cli, you can enable it byRSPACK_PROFILEenvironment variable. - if you are using
@rspack/corewithout@rspack/cli, you can enable it byrspack.experiments.globalTrace.registerandrspack.experiments.globalTrace.cleanup, checkout how we implementRSPACK_PROFILEin@rspack/cliwith these two function for more details.
Chrome
tracing-chrome is supported for viewing tracing information graphically.
Setting the environment variable RSPACK_PROFILE=TRACE=layer=chrome before running Rspack, for example
produces a trace file (.rspack-profile-${timestamp}-${pid}/trace.json) in the current working directory.
The JSON trace file can be viewed in either chrome://tracing or ui.perfetto.dev.
Terminal
Granular tracing event values can be viewed inside the terminal via RSPACK_PROFILE=TRACE=layer=logger, for example
will print the options passed to Rspack as well as each individual tracing event.
Nodejs Profiling
If we find that the performance bottleneck is on the JS side (e.g. js loader), then we need to further analyse the js side, and we can use Nodejs Profiling to analyse. for example
or
this will generates a cpu profile like CPU.20230522.154658.14577.0.001.cpuprofile, and we can use speedscope to visualize the profile, for example
Rsdoctor Timeline
If we want to analyze the time cost of loaders and plugins or the compilation behavior of loaders, we can use Rsdoctor to view:
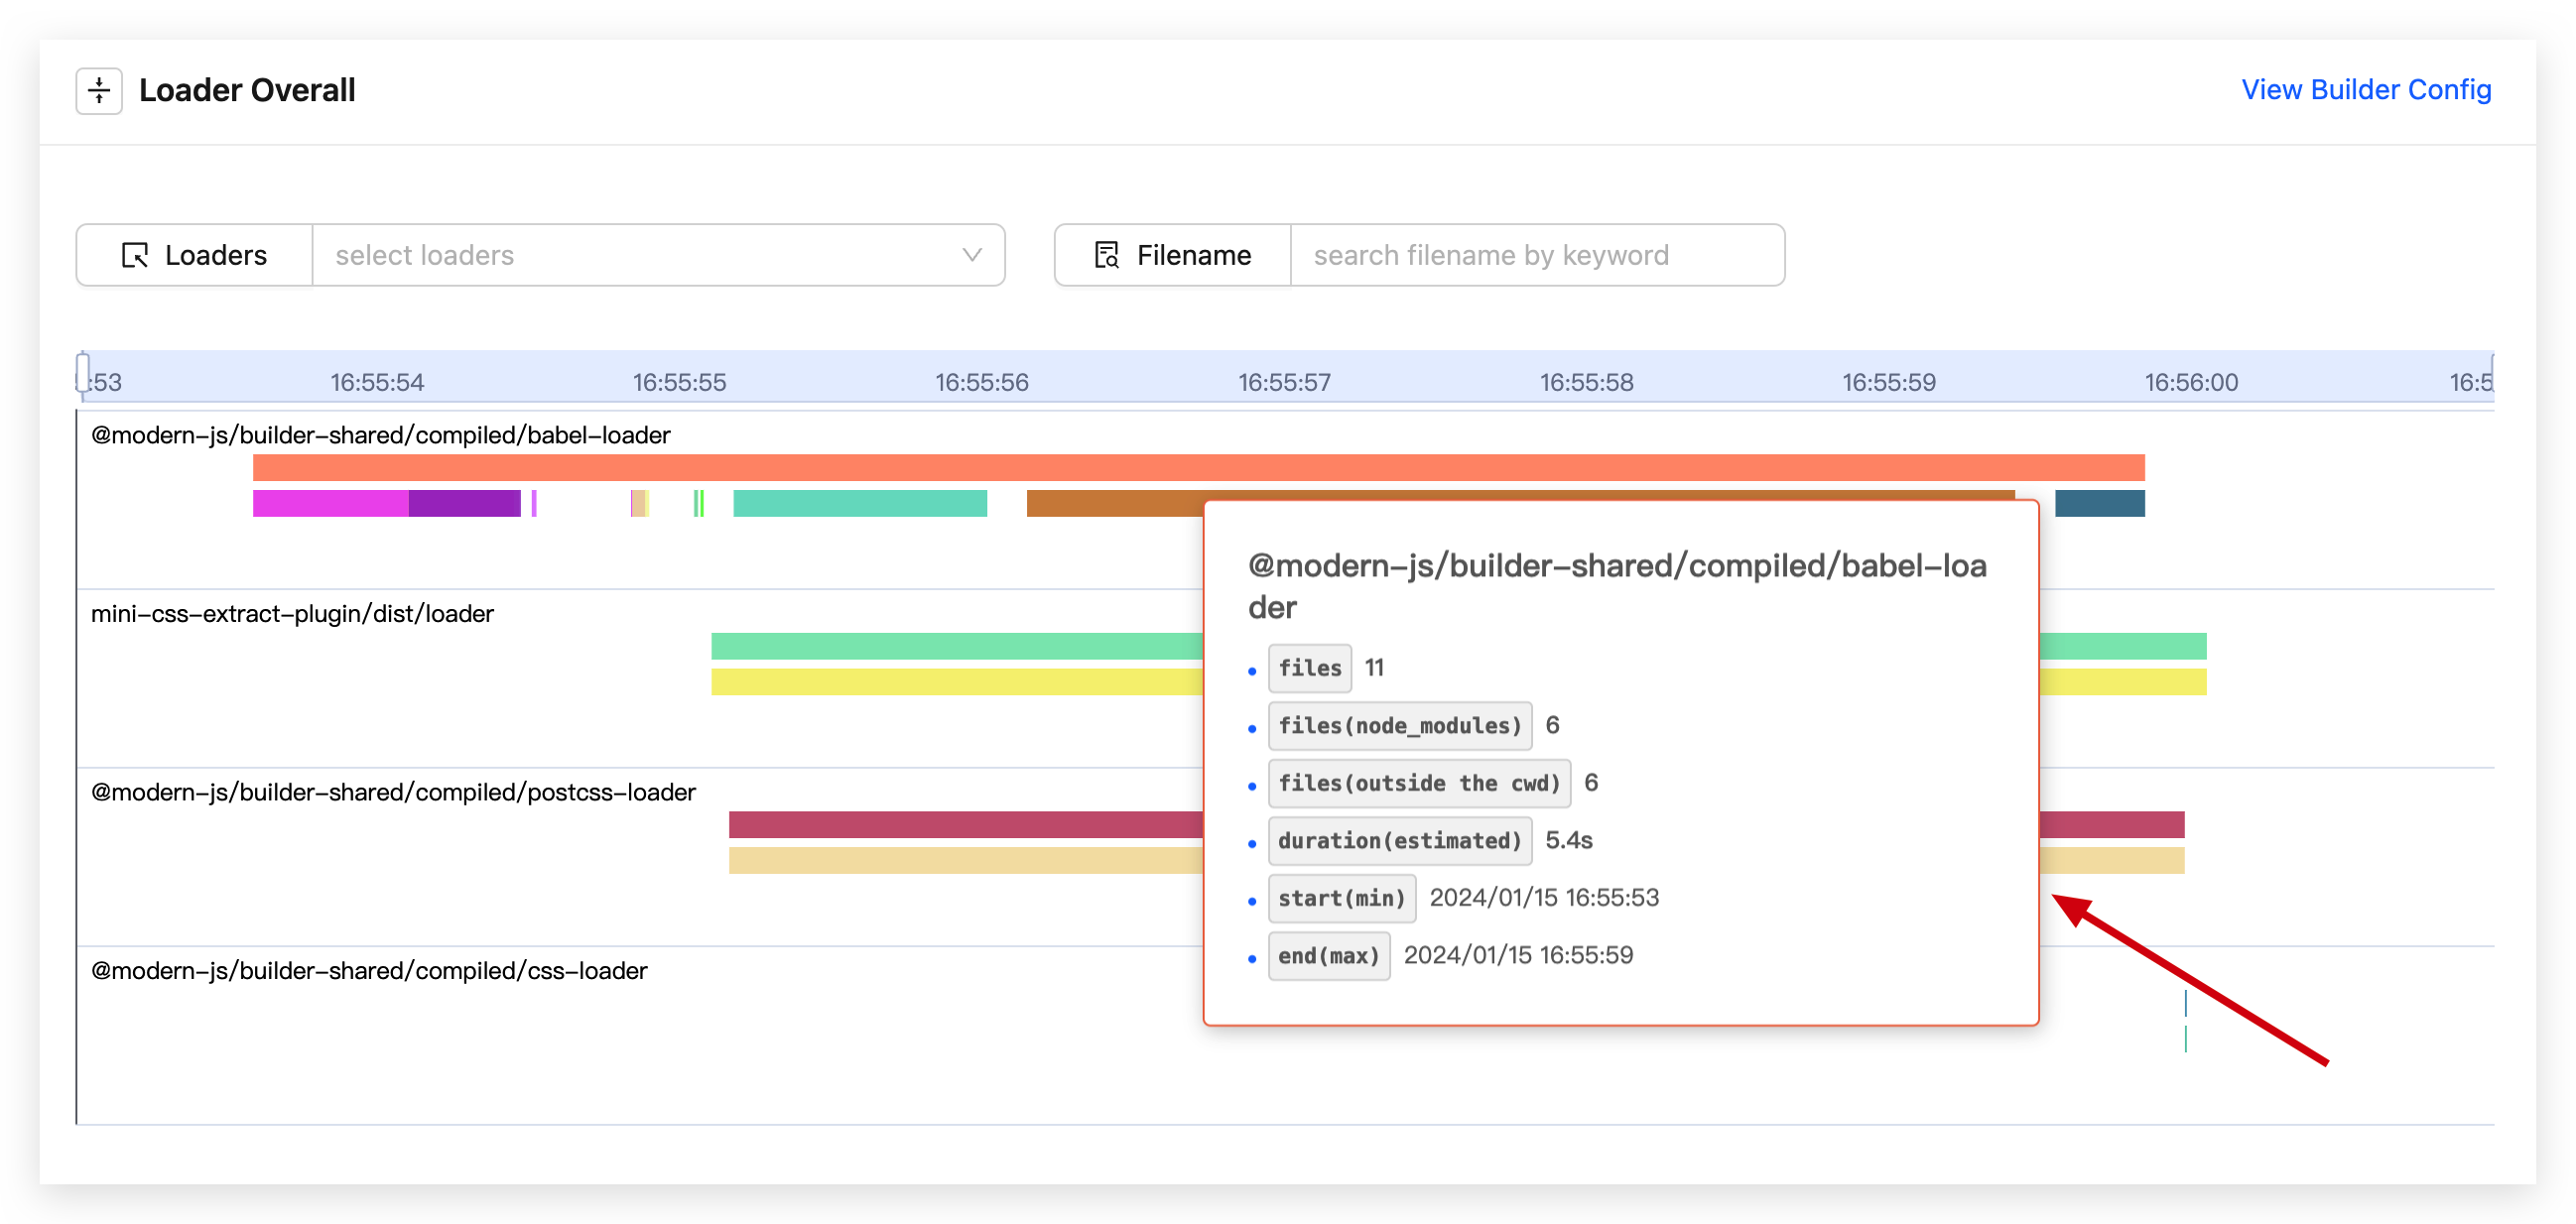
Refer to Rsdoctor Compilation Analysis
Mac Xcode Instruments
Xcode instruments can be used to produce a CPU profile if you are on a Mac.
To install Xcode Instruments, simply install the Command Line Tools:
For normal Rust builds, cargo instruments can be used as the glue
for profiling and creating the trace file.
Since Rspack takes quite a while to build, you can use the following procedure without invoking cargo instruments.
It has the same effect.
In workspace root's Cargo.toml, turn on debug symbols and disable symbol stripping in the [profile.release] section
Then build the project
The final binary is located at packages/rspack-cli/bin/rspack once the project is built.
Under the hood, cargo instruments invokes the xcrun command,
which means we can run the following in our own project that uses Rspack.
It produces the following output
We can open the trace file by